WT & CFD Correlation
Model Train Results
Development by Simulation and Experimentation
As part of the aerodynamic development, the use of computational fluid dynamics (CFD) is paramount, however CFD simulations without proper calibration to physical experimental testing can be inaccurate.
CFD is a complex tool that uses numerical methods to converge to a solution of a flow field and to do this efficiently, the methods rely on empirical equations from simplified experiments. The coefficients used for these equations can differ between use cases. Because of this, when running CFD simulations it is always advisable to validate the results by experimental tests and correlation studies.
Our development approach follows a design loop of product design, simulation and results analysis tied to experimental validation for correlation purposes.
At VFluidAdvanced Technologies, we run proprietary turbulence model settings when running steady state RANS models (Reynolds Averaged Navier Stokes) based on prior experimental tests to ensure that the results are as close as possible to reality when applied to external aerodynamic of trains. This type of simulation can be very powerful and cost-effective when used during initial stages of development, however the use of high accuracy transient simulations is recommended for the later stages of development.
VFluid Advanced Technologies has performed several different wind tunnel tests together with our partner Deflect Inc. to ensure that our internal CFD methods are a good and accurate representation of reality. This process involves replicating the CFD geometry at scale and including force and pressure tap sensors as well as performing some flow visualization techniques. As part of the preparation for the wind tunnel test, several CFD simulations are performed to ensure that the wind tunnel boundary conditions are replicated, therefore ensuring an accurate representation of the experimental test.
Wind Tunnel Facilities and Setup for Correlation Studies
Two tests have been conducted, one with a simplified model of an ICE2 passenger train for the RoofRider development and one with an Autorack model for the SideRider development. The wind tunnel (WT) chosen for both wind tunnel tests was the GroWiKa of Technische Universität Berlin. It is a WT which allows for a model scale of 1:20 and brings an experienced team in train wind tunnel testing.

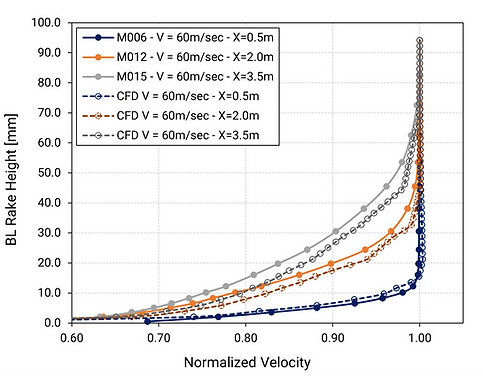
In both cases the train models included force measurements as well as pressure measurements embedded inside the model and the use of a boundary layer rake to measure the boundary layer growth. All these measurements were used for comparison to our CFD model in order to improve correlation.

The boundary layer rake was located inside the empty tunnel at three different positions behind the leading edge of the WT split plate. The results were compared to CFD simulations carried out with the entire WT setup. Results show that the CFD simulations predict a similar boundary layer growth and behavior to what was measured in the WT test.


ICE2 Wind Tunnel & CFD Correlation
Starting with the ICE2 model test, the train was simplified by removing the wheels and bogies. CFD simulations showed that when dealing with stationary ground there was a significant growth of the boundary layer under the train which affected some of the deltas observed on the development CFD simulations. By removing the bogies, the wake under the car reduces and becomes closer to the flow field when a moving ground is used.
The model was fitted with 64 pressure taps located on the nose and rear face of the train, as well as along the symmetry plane and inter car gaps. The plots below show the correlation between WT and CFD results.


Similar to previous plots, the plot below shows the pressure taps at the rear face. In this case the delta between WT and CFD results remains small for most measurements, except in highly separated areas where the inherent limitations of RANS turbulence models become a limiting factor.


Another important part of correlation is ensuring that the deltas between parts are as close as possible to the experimental data. The plots below show that the CFD results provide comparable deltas to the WT results. This plot shows the pressure difference between the baseline ICE2 train and a train with a RoofRider option fitted.

Autorack Wind Tunnel & CFD Correlation
A second wind tunnel test was carried out with a set of 3 Autoracks and a frontal car with a bluff body which generated a similar boundary layer to the one observed in long train simulations. The purpose of the test was to validate the drag reduction from the SideRider when applied to Autoracks.
The wind tunnel setup was similar to the one used with the ICE2, although the model was more complex and representative of real Autorack cars. The model included 32 pressure taps and force measurements of the first car. The wind tunnel test included an array of SideRider options to be tested in straight line and yaw with solid and porous side walls.

The data shows a good correlation between WT and CFD results, both on pressure taps and force measurements. The plots below show the pressure delta measured between the baseline train configuration and the addition of a SideRider option both in WT and CFD. It is possible to see that the pressure deltas observed both in the WT and CFD follow the same trends and magnitudes. In this particular comparison, the WT results measured a drag reduction at car 1 from the SideRider of -12.5%, while CFD results predicted a drag reduction at car 1 of -13.2% (for SideRider option SR03).


For reference, the plots below show all the drag force coefficient deltas from the different SideRider configurations tested in the wind tunnel. As an example, the SideRider SR03 option reduces car 1 drag in straight line by -14.1% with porous walls and by -12.3% solid walls. When running at a yaw angle of 6deg it provides an approximate drag reduction of -4% for porous and solid walls.


